What can make a rain forecast go wrong?

A familiar situation: local weather forecasts show a sunny day – but suddenly a lot of rain falls in just a few minutes. Or the other way around; forecasts show rain, but none falls. What makes this happen?
Forecast problems are frustrating to both the viewer of the forecast, who may have planned their day according to the rain forecast, and also the meteorologist on duty who is in charge of the forecast.
Rain showers are impossible to predict completely accurately
There is a limit to how accurately forecast computers are able to predict weather – rain showers are a prime example.
Computers that make weather forecasts are supercomputers with huge machine halls equipped with the newest and most powerful available technology.
Despite the most powerful computers available, global weather forecast makers constantly have to balance between speed and accuracy.
Forecasts need to be as accurate as possible, but computing times need to be short enough that producing the forecast makes any sense. A daily weather forecast that takes two weeks to make is of no use to anyone, no matter how accurate.

Global forecasts, which are used as the base of all weather forecasts, have a horizontal resolution of about 4–6 miles. That means they can only "see" what the weather is like according to the forecast in points that are 4–6 miles apart. What might happen in weather between these points is deduced by filling in the gaps by educated guesses using the best available scientific methods.
How does this relate to rain showers?
As far as meteorological phenomena go, rain showers are quite small in size. The base of a rain shower cloud can be much smaller than a square mile. Also locations where rain showers are formed are, if not completely random, still quite impossible to predict accurately.
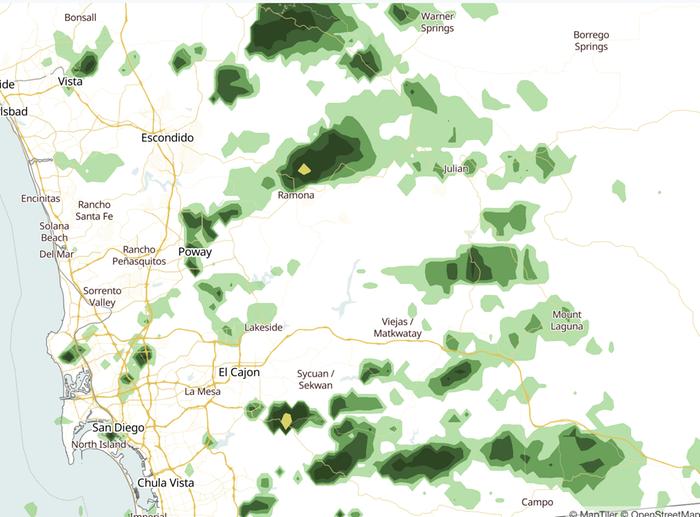
On a map a day with rain showers can look like this. Often on days with a lot of rain shower activity radar images are filled with tiny dots representing rain.

For weather forecast computers these rain shower dots are simply too small and two close to each other to be seen accurately with the computers' 4–6 mile resolution.
Time adds even more difficulty to the task. Each of the rain shower dots has a life of its own. On a weather radar animation map dots representing rain showers constantly appear and disappear. Some dots fuse together, forming longer-lasting, bigger showers. All dots move with the air flow on the height level of the clouds.
Most weather forecast computers predict weather with time steps of one hour or longer for each of the points that are 4–6 miles apart. Since the lifespan of an average rain shower is often less than an hour, weather forecast computers miss most of the action.
How can one even try to forecast rain showers?
Because the small size and short lifespan of rain showers makes predicting individual rain showers impossible, computers don't even try to catch each individual tiny rain shower.
Instead computers are quite skilled at predicting areas where rain showers occur, and rainfall amounts expected in that area.
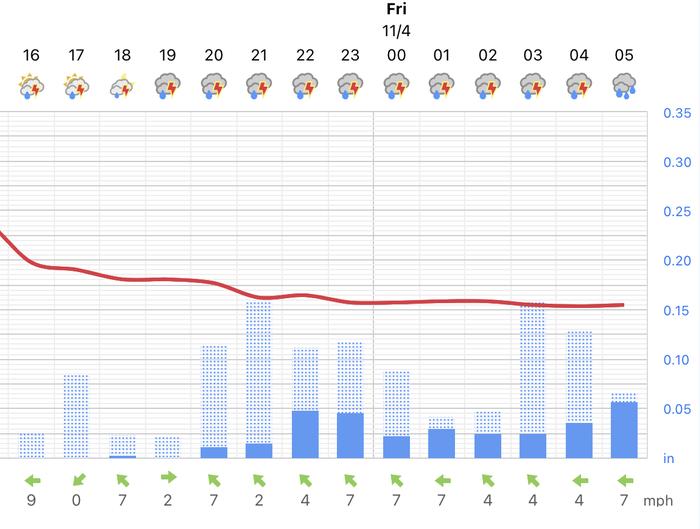
In our services the chance of rain showers is shown as vertical bars on a graph.

The solid part of the rain forecast bar shows how much rain is pretty certain to fall according to the forecast, often as continuous rain. A lighter blue, shaded part of the bar shows how much rain may fall according to the forecast at most. This color represents a chance of rain showers.
Each bar represents the rainfall amount since the previous time step. For example in this image, the bar at 2 A.M. shows the rainfall amount between 1 A.M. and 2 A.M.
Even when the bar color is solid, rainfall is not 100% certain. There is always some difference between a forecast and actual weather.
Looking at the bars on the forecast one can deduce whether the rain predicted for the area comes as rain showers (the lighter blue area is larger) or continuous rain (the solid color blue area is larger).

If you're planning outdoor activities that are weather sensitive, it's best to use rain forecast animations in conjunction with the local weather forecasts.
Rain shower area predictions made by computers are never perfect; a few stray showers almost always appear outside the main area where showers are predicted to occur. So, if maps show rain showers are expected within 50 or so miles within your location, there is some risk of an unexpected shower.
You can find Foreca's rain radar and forecast maps here:
www.forecaweather.com/weathermap/radar
Predicting areas with continuous rain also presents its own challenges. These challenges mainly have to do with the precipitation area being of slightly different shape than in the forecast. Also the timing or route of the precipitation area may differ a bit from the forecasts, causing problems in some locations' forecasts.
The occasional unavoidable issue aside, the improvement in weather prediction in recent decades has been staggering, and the progress will continue as new technical solutions are constantly being developed. This improvement has also shown in rain forecasts and is likely to do so also in the future.
Article last updated 11/23/2022, 9:23:00 AM

